LAND USE CHANGES IN THE VALLEY ZONE: AGARA-BELLANDUR WETLAND
|
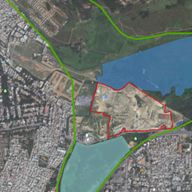
Comprehensive development plan for Bangalore city (CDP 2015; RMP) delineates the region to be protected in Bangalore. Valley zones which are essentially flood plain region with wetlands are protected as per this norm. Figure 1 maps the valley zone in Bangalore while Figure 2 identifies the proposed SEZ in Agara Bellandur wetland (valley zone). This region is earmarked for SEZ is identified in CDP for setting up of treatment plant (solid and liquid waste), parks, and other public utilities.
 
Figure 1: Bangalore City Development plan 2005 - 2015

Figure 2: Violations in the valley zone as per the City Development Plan 2005- 2015
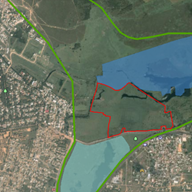
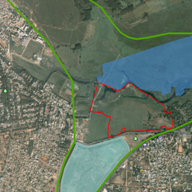
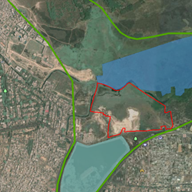
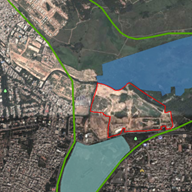
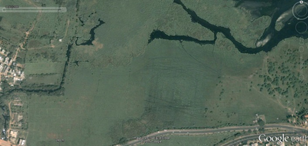
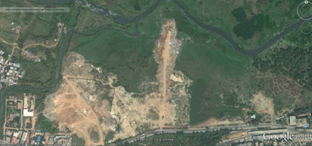
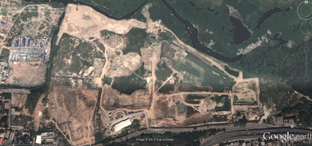
Fig 3 depicts the landscape dynamics during 2000 to 2015 (mapped on temporal Google Earth data – http://earth.google.com). Landscape alterations gained momentum with land acquisition by KIADB (through the project proponents). The remote sensing data of 2009 – 2015 substantiates the unabated construction activities in the valley zone (without proper compliance and gross violations of environmental norms). Table 1 highlights extent of landscape alterations and unauthorized occupation of wetlands (Agara-Bellandur wetland).
|
|

|
a) 2000 |
b) 2003 |
c) 2005 |

|
|

|
d) 2007 |
e) 2009 |
f) 2010 |
|
|
|
g) 2012 |
h) 2013 |
i) 2015 |
Figure 3: Landscape dynamics in the valley zone
Figure 4 gives cadastral map (1904, scale: 1 in 7920) of the region with land uses - drainage network, agriculture land parcels, tank boundaries, etc.Figure 5 gives the region (with land parcels) for the proposed SEZ.
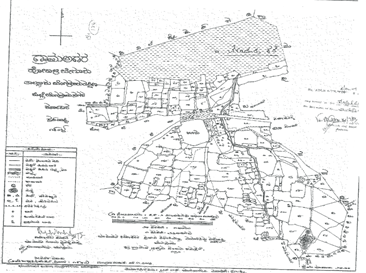
Figure 4: Cadastral Map with lakes (1904)

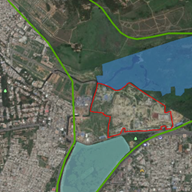
Figure 5: Land allocated for SEZ in 2007.
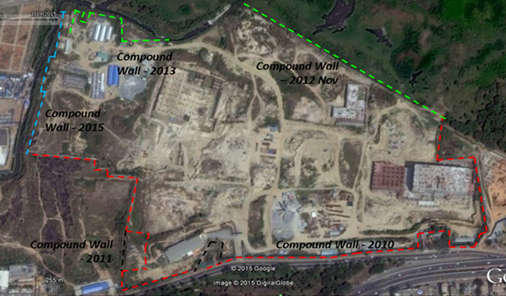
Figure 6 gives the boundary with respective survey numbers of land parcels. Figure 7 is an overlay of figure 6 on the Google earth (http://earth.google.com). This reveals an initiation of construction activities during 2010 – construction of compound walls, filling up of low lying areas with building debris and excavated earth. Figure 8 gives the current spatial extent of construction activities (with compound wall) as on 2015 which is given in Figure 9a and 9b (current boundary and boundary as per KIADB, overlaid on Google earth). This also highlights encroachments of a portion of Rajakaluves and also lake bed. Figure 10a to 10g illustrates changes in the landscape analysed using temporal remote sensing data, which indicates:
- landscape alterations in the wetland region (identifies for SEZ in 2007).
- Cement walls were erected along the boundary (Fig 4) in 2010.
- Rampant dumping of building debris in rajakaluve, low lying areas of the wetlands and digging work for construction of 3 basement floors.
Table 1 lists the spatial changes during 2007 to 2010, which indicates an encroachment to an extent of 10 acres 14.61 guntas in the region (lake bed 3 acre 30 guntas, Rajakaluves )
Table 1: Extent of encroachment and illegalities in the SEZ
Year |
Land allocated |
Encroachment |
Total land |
2007 |
63 Acres 37.5 Guntas |
- |
63 Acres 37.5 Guntas |
2010 |
63 Acres 37.5 Guntas |
2 Acres 34.86 Guntas |
66 Acres 32.3 Guntas |
2012 |
63 Acres 37.5 Guntas |
8 Acres 14.21 Guntas |
72 Acres 15.9 Guntas |
2013 |
63 Acres 37.5 Guntas |
10 Acres 14.61 Guntas |
74 Acres 12.1 Guntas |
2015 |
63 Acres 37.5 Guntas |
10 Acres 14.61 Guntas |
74 Acres 12.1 Guntas |

Figure 6: Allocated land for Mantri developers by KIADB overlaid on Cadastral Map
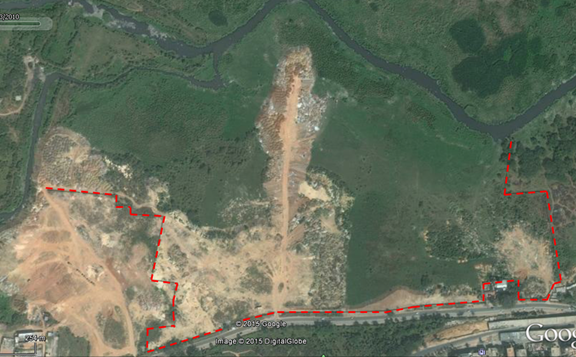
Figure 7: Compound walls built in 2010

Figure 8: The region with construction activities with compound wall on the cadastral map.
Figure 9a: Spatial expansions during 2010-2015 (shown in pink)
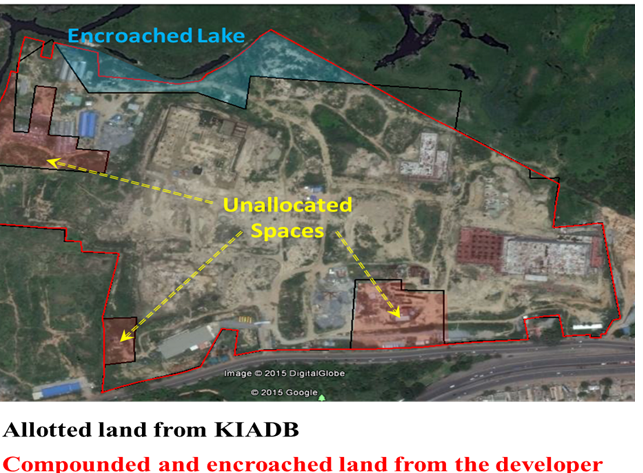
Figure 9b: Land use alterations in the region (on map and on Google earth)
|

|
a) 2000 |
b) 2005 |

|
|
c) 2007 |
d) 2010 |
|

|
e) 2012 |
f) 2013 |
|
g) 2015 |
Figure 10: Landscape dynamics
|